2.0 KiB
2.0 KiB
Install required dependencies for matplotlib GUI frontend and all pip other packages for this project
sudo apt install python3-tk
python3.9 -m pip install -r requirements.txt
Given a set of tuple (X,Y) data points as [(X, Y), .., (X, Y)], determine the
best fitting line plot, and then apply this projection to predict the dependent Y
value using an independent GIVEN_X value.
python3.9 linear-regression.py -h
usage: linear-regression.py [-h] [--silent] [--file [FILE_PATH]] [GIVEN_X] [X,Y ...]

Find most fitting line plot for given data points and predict value given some X

positional arguments:
  GIVEN_X               Value for X for prediction using linear regression
                            (default: '4.5')

  X,Y                   A list of data points separated by spaces as: x,y x,y x,y ...
                            (default: '[(1, 3), (2, 7), (3, 5), (4, 9), (5, 11), (6, 12), (7, 15)]')


optional arguments:
  -h, --help            show this help message and exit
  --silent              When this flag is set, line plot visualization will not be shown
                            (default: 'False')

  --file [FILE_PATH], -f [FILE_PATH]
                        Optionally provide file for data to be read from. Each point must be on it's own line with format x,y
By default, the following linear regression is calculated and displayed
python3.9 linear-regression.py
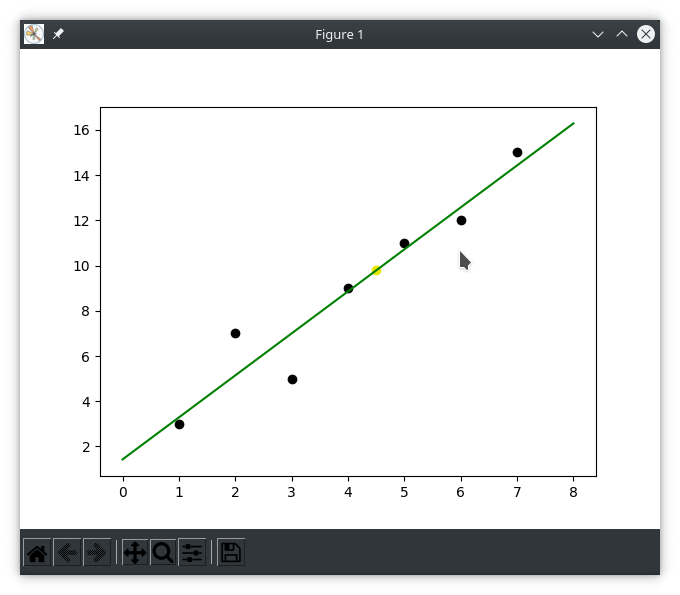
Finding fitting line plot for given data [(1, 3), (2, 7), (3, 5), (4, 9), (5, 11), (6, 12), (7, 15)]
points_avg: (4.0, 8.857142857142858)
variance: (28.0, 104.85714285714286)
sigma: (2.160246899469287, 4.180453381654971)
covariance: 8.666666666666666
correlation: 0.9596775116832306
Our line Y = BX + A must pass through the point (4.0, 8.857142857142858)
Y = (1.8571428571428565)X + 1.4285714285714315
For X = 4.5, Y is predicted to be 9.785714285714285